
FinTech · Data Visualization
Interactive charting platform for financial market data
A subscription site built around interactive financial charts, serving millions of page views a month. As the sole engineer, I ended its recurring outages early on, redesigned how charts are built and served, and rebuilt the subscription flow.
Overview
The platform is a site for people who follow financial markets through data. It’s built around interactive charts, with some behind a paywall. It grew quickly in its first years into a high-traffic site.
I joined as the previous developer was leaving and took over as the only engineer. The codebase hadn’t kept up with that growth, and the first thing to fix was a site that kept going down under heavy traffic. From there I moved on to the charts and subscriptions at the heart of the product.
What I built
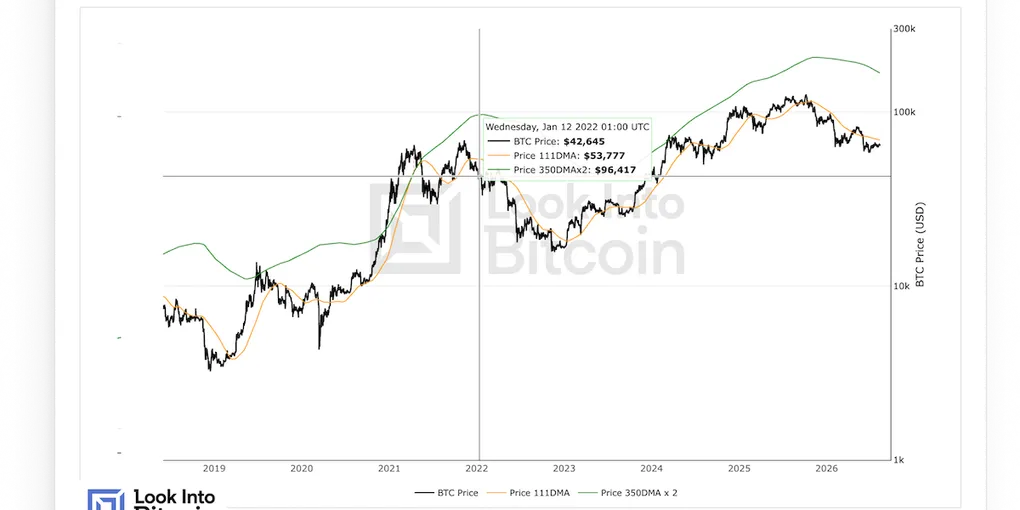
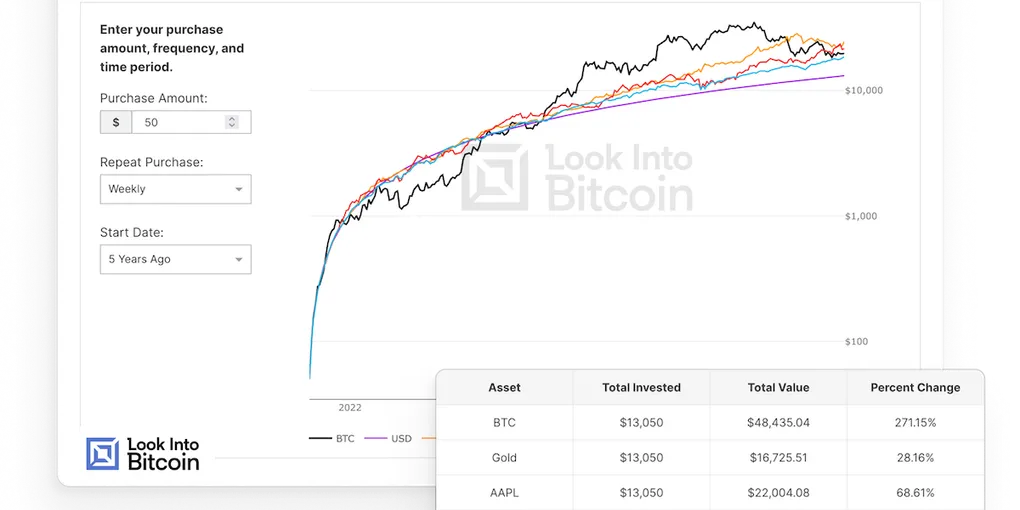
- A new chart pipeline. The product was built around charts, over a hundred of them, across pages that mix written content with the charts. The legacy version was built with an unoptimized approach for data ingestion, chart generation, and rendering. I designed and built one shared pipeline for all charts. It has scheduled jobs that fetch external data, chart data built on the fly with caching, and a unified rendering engine. Scheduled jobs and cache invalidation depend on the update frequency of underlying data. So charts stay updated without consuming unnecessary resources, which matters at a few million page views a month.
- One rendering engine for every chart. Each chart used to have its own rendering code. I built a single JavaScript engine that renders any chart from the pipeline’s output, using Plotly underneath.
- Simpler infrastructure. The platform ran across several separate services, each duplicating significant code. This made updates tedious and slow. I merged what belonged together and removed unnecessary things, so the platform became much easier to maintain.
- Ending intermittent outages. The site went down for hours every few days, during peak traffic. The first plan was to add server capacity, but when I dug in, the servers were never at capacity. The real limit was the app’s own configuration. It couldn’t use enough of the server to trigger autoscaling, so the site stalled with most of the server capacity unused. Adding servers would have added cost without fixing it. I fixed the configuration in my first week, and the site didn’t go down again for the rest of the project.
- A reliable subscription flow. The subscription flow was inconsistent across the site. Most paths didn’t account for the user’s current plan or stay in sync with Stripe, so users could end up paying twice, which led to support requests and refunds. I rebuilt it as one consistent flow that always knows the user’s plan and added upgrades, downgrades, and cancellations, so managing a subscription became simple and reliable.
Key decisions
Build charts from raw data on demand, not from pre-built files. The old jobs saved a finished chart file for every chart and variant. I stored the raw data from each source instead and built charts from it when requested, cached until the data changed. One fetch now serves every chart that uses that source, and changing a chart doesn’t mean changing how its data is collected.
Move charts over gradually, not in one rewrite. Moving every chart at once would have stalled feature work for months. Instead, the new pipeline ran alongside the old one, and a chart moved over when it was being created or changed anyway. The platform kept getting better without holding up new work. The trade-off was running two systems side by side for a while.
Serve chart data through an API, not Django templates. The client planned to move the frontend to React eventually. Plugging the new pipeline into templates would have meant redoing the work later. So the pipeline serves chart data through an API from the start.
PostgreSQL instead of BigQuery. BigQuery is built for far more data than this platform had. Keeping everything in the main PostgreSQL database meant one less service to run, and chart data sat right next to the rest of the app’s data.
How it went
I was the only engineer on the platform and worked directly with the client, owning the technical side end to end. New charts went onto the new pipeline from the start, existing ones moved over as they came up for changes, and the subscription flow was rebuilt. When I handed over, the client was happy with the work, and I stayed available for support afterward.
The biggest business impact came from my first piece of work. The outages were the client’s most pressing problem, and once they were fixed, the site stayed up through every traffic peak.
- Built with
- Django, Django REST Framework, Celery, PostgreSQL, Redis, Plotly, Google Cloud Platform, Stripe